Technical Evaluation of Laminate Stacking Assembly Placement Accuracy
Microfluidic technologies are critical in today’s advanced healthcare and diagnostic tools. One essential component of these technologies is microfluidic lamination, whose precise manufacturing and alignment can dramatically affect a device’s functionality.
At Resonetics, we are a market leader in manufacturing microfluidic laminates for point-of-care diagnostics and lab-on-a-chip devices. Microfluidic laminates are manufactured by carefully aligning and bonding a series of layers produced by laser processing, rotary, and flatbed die cutting, or molding. For the device to function properly, it is critical to have precise alignment between the different layers of the device.
When first engaging with new customers on a project, they consistently ask us about the placement accuracy and capabilities of different manufacturing processes. The best way to answer any technical question is with data, so we ran an experiment to compare three manufacturing methods with the same format and design of assembly layers. These two layers are representative of two microfluidic layers that are common in products currently in commercial production. The three manufacturing methods we compared are:
- Manual Assembly
- Commercially Available Robotic Stacking
- Proprietary Flexstacker™ Automated Assembly Equipment
Manual assembly involves an operator using alignment pins to assemble the parts. Commercially available robotic stacking refers to standard processing equipment purchasable within the industry. The Flexstacker™ is a proprietary, custom-built robotic assembly machine exclusive to Resonetics.
To evaluate the processes, we calculated their capabilities by measuring 40 parts of each assembly on a MicroVu platform. The commercially available robotic stacking equipment used two fiducial marks for pick and place and two marks for post placement quality check. The Flexstacker™ automated placement uses vision to check final placement. Parts placed out of placement specification are rejected using post placement vision measurements.
Test Method
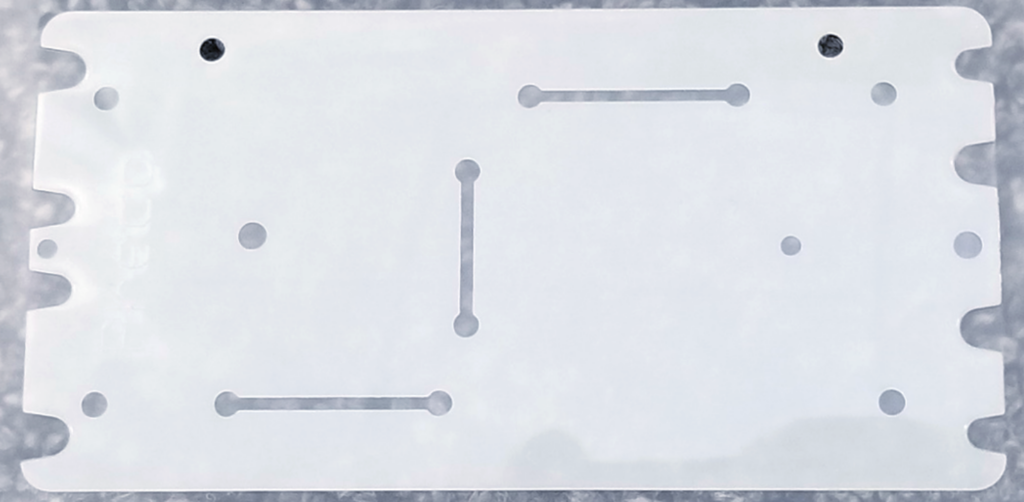
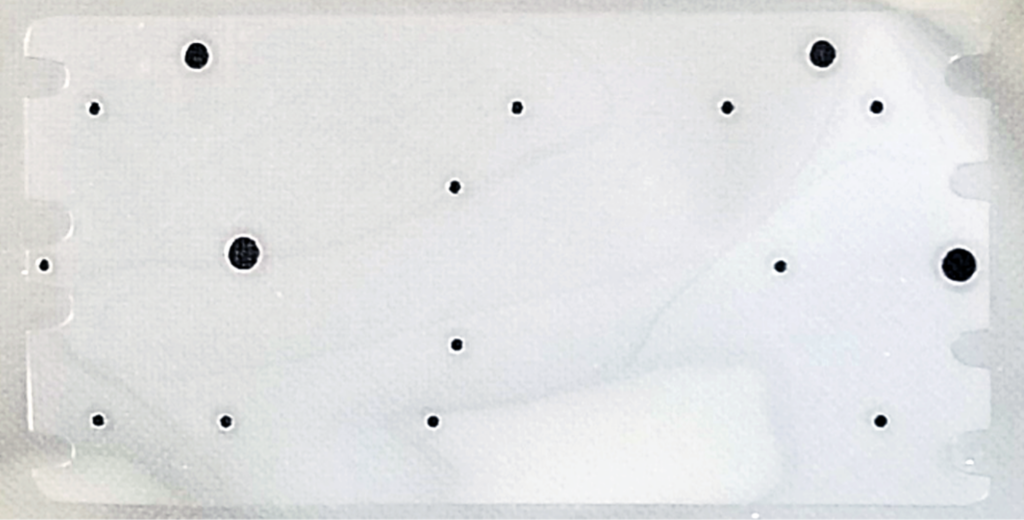
Let’s get into the details of setting up our test method. We selected two representative microfluidic layers for placement. The features needed for manual assembly and commercially available robotic stacking were included in the layers. The manual pin assembly process used the two holes on each layer identified in Figures 1 & 2. The assembly fiducials for both the commercially available robotic stacking and Flexstacker™ used the same points identified in Figures 1 & 2. The four automation fiducial points have a different size diameter in each layer. The two concentric circles on each layer can be located by the MicroVu platform for accurate position measurements. We measured all cut layers during initial processing and after placement. Cut capability was all within specification based on MicroVu measurements. Forty assembled parts were measured for each placement method. In addition, we ran the commercially available robotic stacking equipment for a longer period to ensure stability. It ran for 85 parts, paused for a break, and ran for an additional 85. The MicroVu data was collected on the first 40 and last 40 parts. The Flexstacker™ was run and placed layers for 1 hour. The first 40 parts, the last 40 parts, and 40 parts from the middle of the run were measured. Data was measured with the MicroVu instrument, and QC Calc software helped support data collection and processing. The call out for the capability study was 0.016” for true position (TP) upper limit (UPL). The capability measure is calculated using:
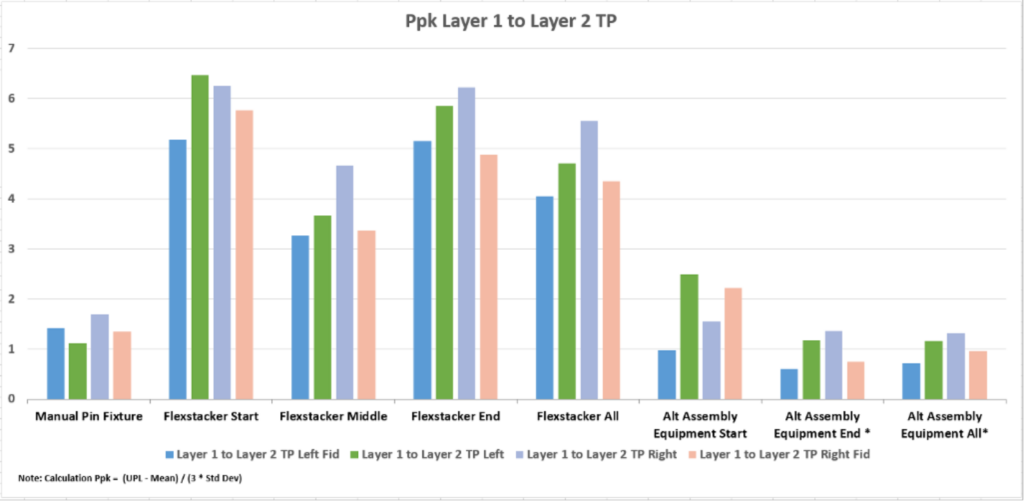
Capability (PpK) = (UPL – Mean) / (3 * Std Dev)
The Flexstacker™ was set to reject any placement with TP outside of the 0.016” tolerance.
Figure 1. Top Placed Layer 2
.
Figure 2. Bottom Carrier Layer 1
Results
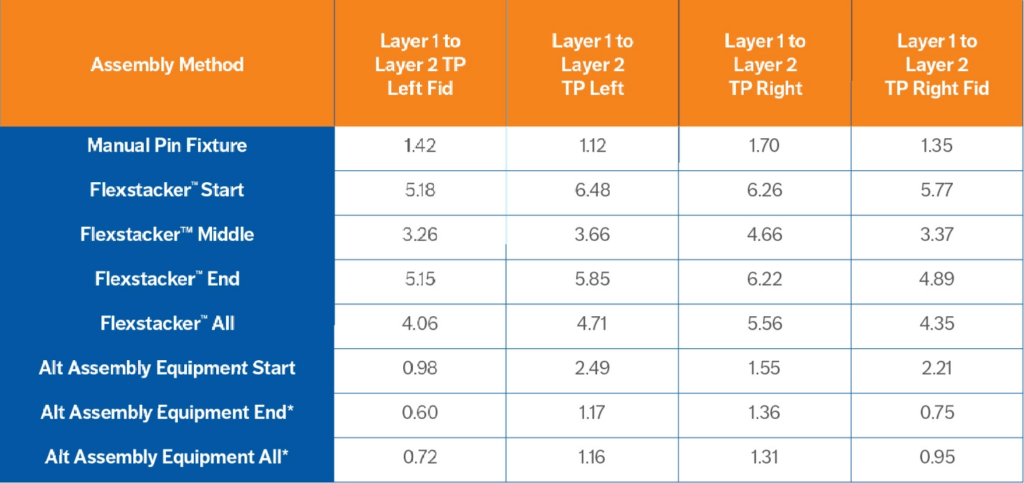
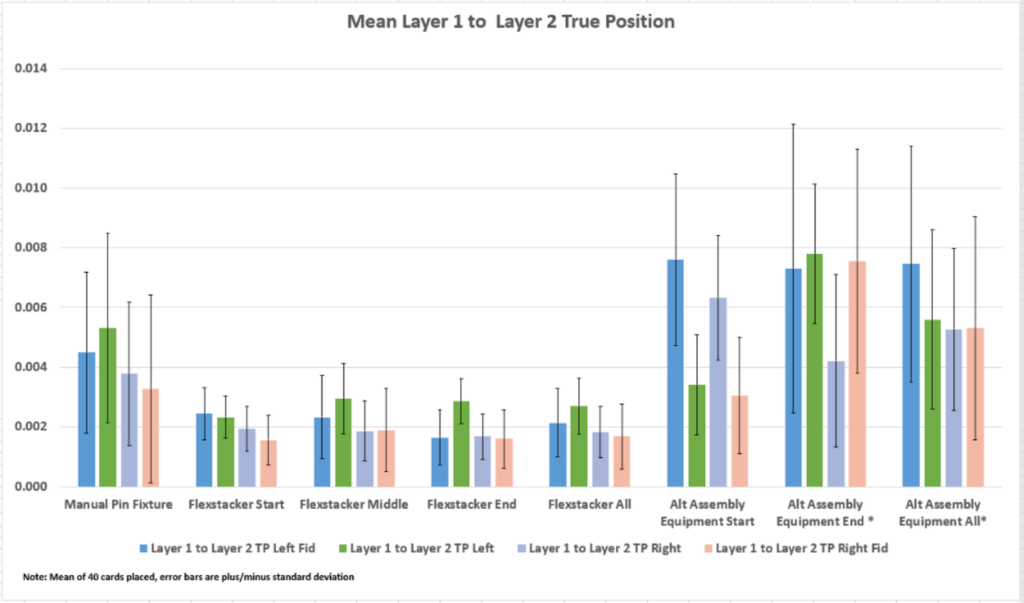
We performed the three assembly methods as detailed in the test method and measured the results. The four fiducials used for automated assembly were collected and plotted. The mean true position (TP) data for each method is listed in Table 1 and plotted in Figure 3. The data for the four fiducials is grouped by assembly method. The error bars show the plus and minus standard deviation for each data set. The data for the capability of each method is listed in Table 2 and plotted in Figure 4. Here is the mean placement for each process:
- Manual Assembly = 0.004-0.010” (100-250µm)
- Commercially Available Robotic Stacking = 0.004-0.008” (100-200µm)
- Flexstacker™ = 0.002-0.003” (50-75µm)
The placement capability was similar in the manual pin assembly (PpK 0.50-1.7) and commercially available robotic stacking (PpK 0.60-2.49). Both placement capabilities are at the limit of the specification. The Flexstacker™ assembly placement had high capability numbers (3.26-6.48).
Conclusion
The data reveals the higher capability and accuracy of placement for our proprietary Flexstacker™ automated assembly process. As expected, the manual pin fixture had the highest variability. The commercially available robotic stacking equipment performed slightly worse. As a note, in production, the commercially available robotic stacking equipment can hold tolerance but needs routine adjustments for optimum operation. The Flexstacker™ data appears much more stable and requires fewer adjustments to stay in specification.
Table 1. Assembly Data for Layer 1 to Layer 2 Mean True Position
.
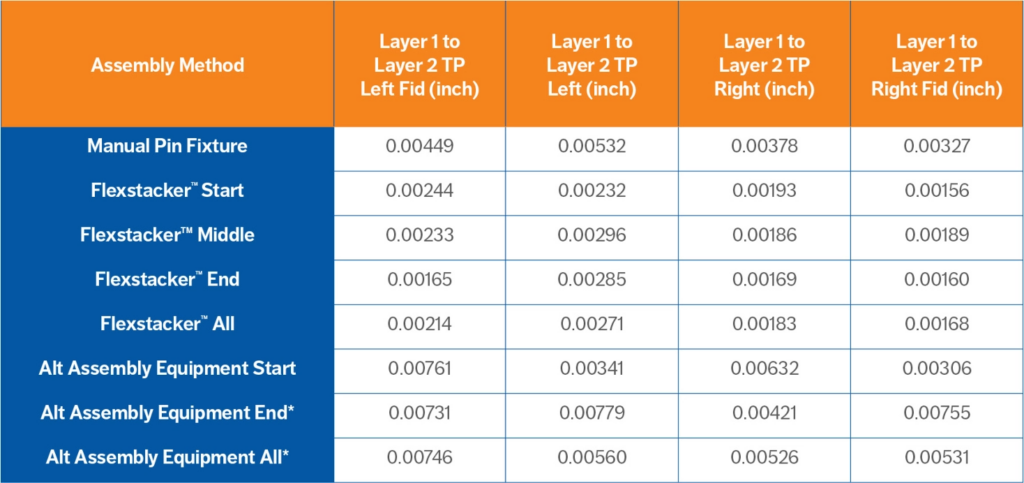
Table 2. Assembly Data for Layer 1 to Layer 2 Capability
.
Figure 3: Mean True Position for 4 Fiducial Points with Standard Deviation Error Bars
.
Figure 4: True Position Capability for 4 Fiducial Points
.
About the Author: Terry Rusch
Terry Rusch is a Manager for Lightspeed Engineering at Resonetics. He is responsible for leading the Lightspeed Lab engineers who focus on prototyping and process development of microfluidic laminates. Prior to joining Resonetics, Terry was a Senior Project Engineer at Preco Medical and Precision Converting. Throughout his career, he has been a key part of many advances in DNA analysis and test methods while working for leading companies and institutions in life science, including the Marshfield Clinical Research Foundation, Prevention Genetics, and Douglas Scientific. While at Marshfield Clinic, Terry was a lead inventor on patents related to SNP and INDEL genotyping, and his team successfully increased genotyping test throughput by over 10-fold while reducing the cost per genotype from $2.50 to $0.05. Terry holds a B.S. in Electrical Engineering from the University of Wisconsin-Madison and a Master’s in Electrical Engineering from the University of South Florida.
Want to discuss a microfluidics project? Talk to our experts:
Terry Rusch, trusch@resonetics.com